

Understanding Database Performance Impact
Your WordPress database is the heart of your site's performance. Every page load triggers dozens of queries, and even small inefficiencies compound quickly under traffic. The good news? You don't need expensive monitoring tools to diagnose bottlenecks. MySQL's native diagnostics, combined with phpMyAdmin and command-line utilities, give you everything needed to identify and resolve database performance issues.
Enabling the MySQL Slow Query Log
The slow query log is your first line of defense. It records queries exceeding a time threshold, revealing exactly which operations slow your site. Enable it by adding these directives to your MySQL configuration file (typically /etc/mysql/my.cnf or /etc/my.cnf):
slow_query_log = 1
slow_query_log_file = /var/log/mysql/slow-query.log
long_query_time = 2
The long_query_time setting defines the threshold in seconds. Start with 2 seconds, then lower it to 0.5 or even 0.1 once you've addressed obvious problems. Restart MySQL to apply changes:
sudo systemctl restart mysql
Monitor the log in real-time during typical site usage:
tail -f /var/log/mysql/slow-query.log
You'll see the actual queries consuming resources, complete with execution times and rows examined.
Analyzing Queries with EXPLAIN
Once you've identified slow queries, use EXPLAIN to understand why they're inefficient. Access your MySQL prompt:
mysql -u root -p your_database
Prepend EXPLAIN to any SELECT query from your slow log:
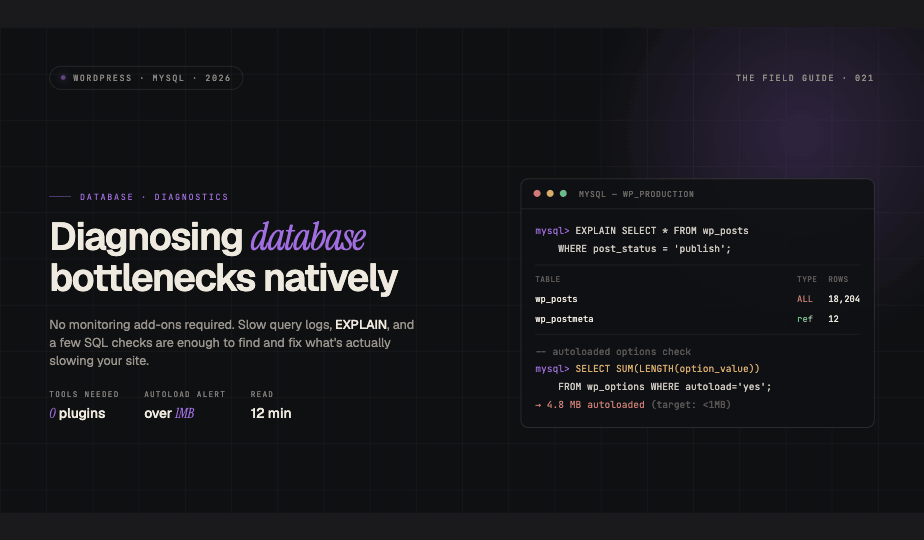
EXPLAIN SELECT * FROM wp_posts WHERE post_status = 'publish' ORDER BY post_date DESC LIMIT 10;
The output reveals MySQL's execution plan. Key columns to examine include type, possible_keys, key, and rows. The type column is particularly important: ALL means a full table scan (bad), while ref or range indicate index usage (good). If key shows NULL, no index is being used, and the rows value indicates how many rows MySQL must examine.
Full table scans on large wp_posts or wp_postmeta tables are common culprits. These often result from plugin queries lacking proper indexes.
Spotting Autoloaded Data Bloat in wp_options
The wp_options table can become a silent performance killer. WordPress loads all autoloaded options on every request, and many plugins abuse this by storing large datasets with autoload enabled. Check your autoloaded data size:
SELECT SUM(LENGTH(option_value)) as autoload_size FROM wp_options WHERE autoload = 'yes';
Anything over 1 MB warrants investigation. Identify the largest offenders:
SELECT option_name, LENGTH(option_value) as size FROM wp_options WHERE autoload = 'yes' ORDER BY size DESC LIMIT 20;
You'll often find abandoned plugin settings, cached data that should be transients, or serialized arrays that grew unchecked. For legitimate options that don't need autoloading, update them:
UPDATE wp_options SET autoload = 'no' WHERE option_name = 'problematic_option';
Always test after changes to ensure plugins still function correctly.
Using phpMyAdmin for Visual Analysis
phpMyAdmin provides a GUI alternative for those less comfortable with command-line work. Navigate to your WordPress database and click the Advisor tab for automated performance recommendations. The Status tab shows real-time statistics including query cache hit rates and table lock wait times.
To examine specific queries, use the Query tab with EXPLAIN syntax. phpMyAdmin color-codes the output, making it easier to spot full table scans and missing indexes. The Structure view for each table displays existing indexes and allows you to add new ones through the interface.
Cleaning Expired Transients
WordPress transients are meant to be temporary, but expired entries accumulate in wp_options because WordPress doesn't proactively clean them. Check how many expired transients exist:
SELECT COUNT(*) FROM wp_options WHERE option_name LIKE '_transient_timeout_%' AND option_value < UNIX_TIMESTAMP();
Delete expired transients safely:
DELETE FROM wp_options WHERE option_name LIKE '_transient_timeout_%' AND option_value < UNIX_TIMESTAMP();
Then remove the corresponding transient data:
DELETE FROM wp_options WHERE option_name LIKE '_transient_%' AND option_name NOT LIKE '_transient_timeout_%' AND option_name NOT IN (SELECT REPLACE(option_name, '_transient_timeout_', '_transient_') FROM wp_options WHERE option_name LIKE '_transient_timeout_%');
For multisite installations, also target _site_transient_% entries. Schedule this cleanup monthly using a cron job or server task.
Identifying Inefficient Plugin Queries
Plugins frequently generate suboptimal queries, especially when handling custom post types or metadata. The slow query log reveals these, but you can also profile live queries by temporarily enabling query logging:
SET GLOBAL general_log = 'ON';
SET GLOBAL log_output = 'TABLE';
Then query the log table after performing an action:
SELECT * FROM mysql.general_log WHERE command_type = 'Query' ORDER BY event_time DESC LIMIT 50;
Look for patterns: repeated identical queries (indicating missing caching), queries with OR conditions that prevent index use, or postmeta queries without proper joins. When you find a problematic plugin, check for updates or contact the developer with your findings.
Maintaining a Lean Database
Prevention beats cure. Regularly audit new plugins before installation by reviewing their database queries. Run OPTIMIZE TABLE monthly on all WordPress tables to reclaim fragmented space. Monitor autoloaded options size as part of your maintenance routine. Document any custom indexes you add and test query performance after major plugin updates.
These native tools give you complete visibility into database performance without additional resource overhead. Master them, and you'll keep your WordPress installation running efficiently at any scale.