
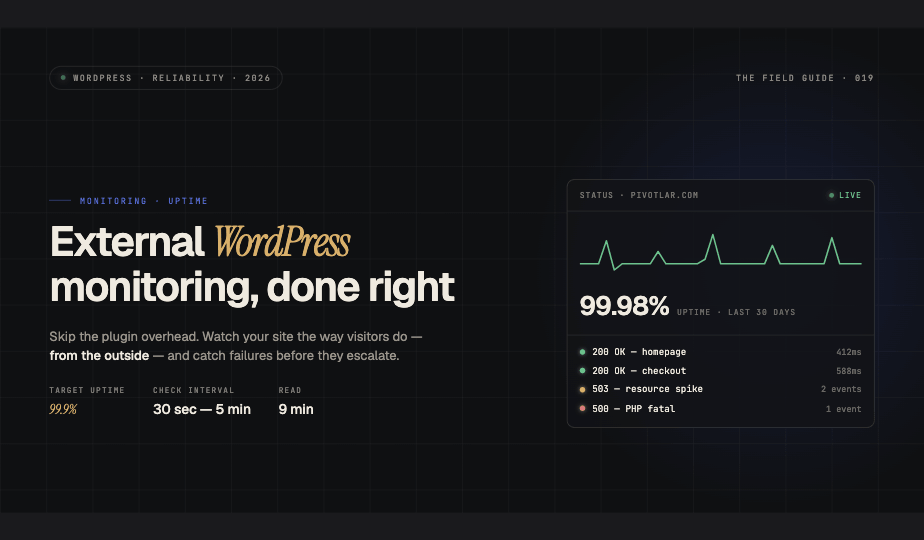

Why External Monitoring Beats Plugin-Based Solutions
Most WordPress site owners instinctively reach for monitoring plugins when they want visibility into their site's health. While convenient, these plugins consume server resources with every page load, add database overhead, and ironically can contribute to the very performance problems they're meant to detect. External monitoring flips this approach: services check your site from the outside, exactly as your visitors experience it, without adding a single line of code to your WordPress installation.
External monitoring catches issues that internal plugins might miss entirely. If your server crashes, a plugin can't alert you, it's down too. External services operate independently, continuously checking your site and notifying you the moment something breaks.
The Metrics That Actually Matter
Not all monitoring metrics deserve equal attention. Focus on these three core indicators that directly impact user experience:
Response Time and Uptime
Response time measures how quickly your server responds to requests. Anything under two seconds is acceptable for most sites, but aim for under one second. Uptime simply tracks whether your site is accessible. Industry standard targets are 99.9% uptime, which allows for about 43 minutes of downtime per month.
HTTP Status Codes
Monitor for unexpected status codes. A 200 OK means everything is working. Watch for 500 Internal Server Error codes that indicate PHP crashes, 503 Service Unavailable suggesting resource exhaustion, or 502 Bad Gateway pointing to web server and PHP-FPM communication issues.
Content Verification
Response time alone doesn't guarantee your site is working correctly. A misconfigured server might return a fast 200 response with an error page. Content verification checks for specific text on your page, like your site title or a unique phrase from your homepage, to confirm WordPress is actually rendering correctly.
Setting Up UptimeRobot for Basic Monitoring
UptimeRobot offers a generous free tier that covers most small to medium site needs. You can monitor up to 50 sites with five-minute check intervals.
Start by creating an HTTP(S) monitor for your homepage. Add your site URL and select a five-minute monitoring interval. Under alert contacts, add your email and consider connecting Slack or Discord for immediate notifications.
Create a keyword monitor next. This checks not just that your site responds, but that it's serving actual content. Add a monitor with keyword alert set to a phrase that appears on every page of your site, like your copyright notice or site name. If your site returns a database connection error, the keyword won't match and you'll get alerted.
Set up multiple monitors for critical pages: your homepage, a blog post, and your contact or checkout page if you run WooCommerce. Different pages stress different parts of your stack, so monitoring variety catches more issues.
Better Uptime for Advanced Monitoring
Better Uptime provides more sophisticated monitoring with a cleaner interface and better notification options. The free tier includes ten monitors with 30-second check intervals.
Beyond basic uptime checks, Better Uptime excels at incident management. When your site goes down, it automatically creates an incident and tracks time to resolution. The status page feature lets you communicate with users during outages without them hammering your already-struggling server with refresh requests.
Configure monitors for your critical endpoints and set up an on-call schedule if you manage sites for clients. Better Uptime can rotate alerts through a team, escalate if no one responds, and integrate with PagerDuty or Opsgenie for enterprise workflows.
Server-Level Health Checks
External URL monitoring catches user-facing issues, but server-level checks provide early warning of resource problems before they impact visitors.
Monitoring PHP-FPM and MySQL
If you have SSH access to your server, set up basic health checks for your core services. Create a simple cron job that checks if PHP-FPM and MySQL are running and sends an alert if either stops. A basic bash script can check process status and send email notifications using the system mail command.
Disk Space and Load Average
WordPress sites fail in predictable ways when resources run low. Monitor disk space, WordPress needs room for uploads, cache files, and logs. Set an alert at 80% capacity to give yourself time to clean up. Watch load average to catch runaway processes before they bring your site down.
Database Connection Pool
MySQL connection exhaustion is a common WordPress failure mode. If you're running a VPS, monitor active MySQL connections. A sudden spike often precedes a complete site failure. Most hosting control panels expose this metric, or you can query it directly with SHOW STATUS LIKE 'Threads_connected'.
Setting Smart Alert Thresholds
Overly sensitive monitoring creates alert fatigue. You'll start ignoring notifications, defeating the entire purpose. Configure your monitors with appropriate thresholds: require two or three consecutive failures before alerting, set response time warnings at 3000ms but only alert at 5000ms, and use different notification channels for warnings versus critical alerts.
Maintenance Windows
Schedule maintenance windows in your monitoring tools before performing updates. Nothing trains you to ignore alerts faster than getting paged while you're intentionally restarting services.
Testing Your Monitoring Setup
Once configured, test your monitoring by intentionally breaking things in a controlled way. Rename your wp-config.php file temporarily to trigger a database connection error. Stop your web server briefly to verify downtime alerts fire. This testing confirms your monitoring works before you actually need it during a real incident.
External monitoring provides peace of mind without the performance cost of plugins. Start with simple uptime checks, add keyword verification, then layer in server-level metrics as needed. When something breaks at 2 AM, you'll get notified immediately, and your site won't be slower because of the monitoring itself.